Quantification of mitochondrial content (i.e. membrane potential dyes, localization of matrix inclusions, protein concentration throughout mitochondria)
Characterize Fluorescence profiles of individual mitochondria
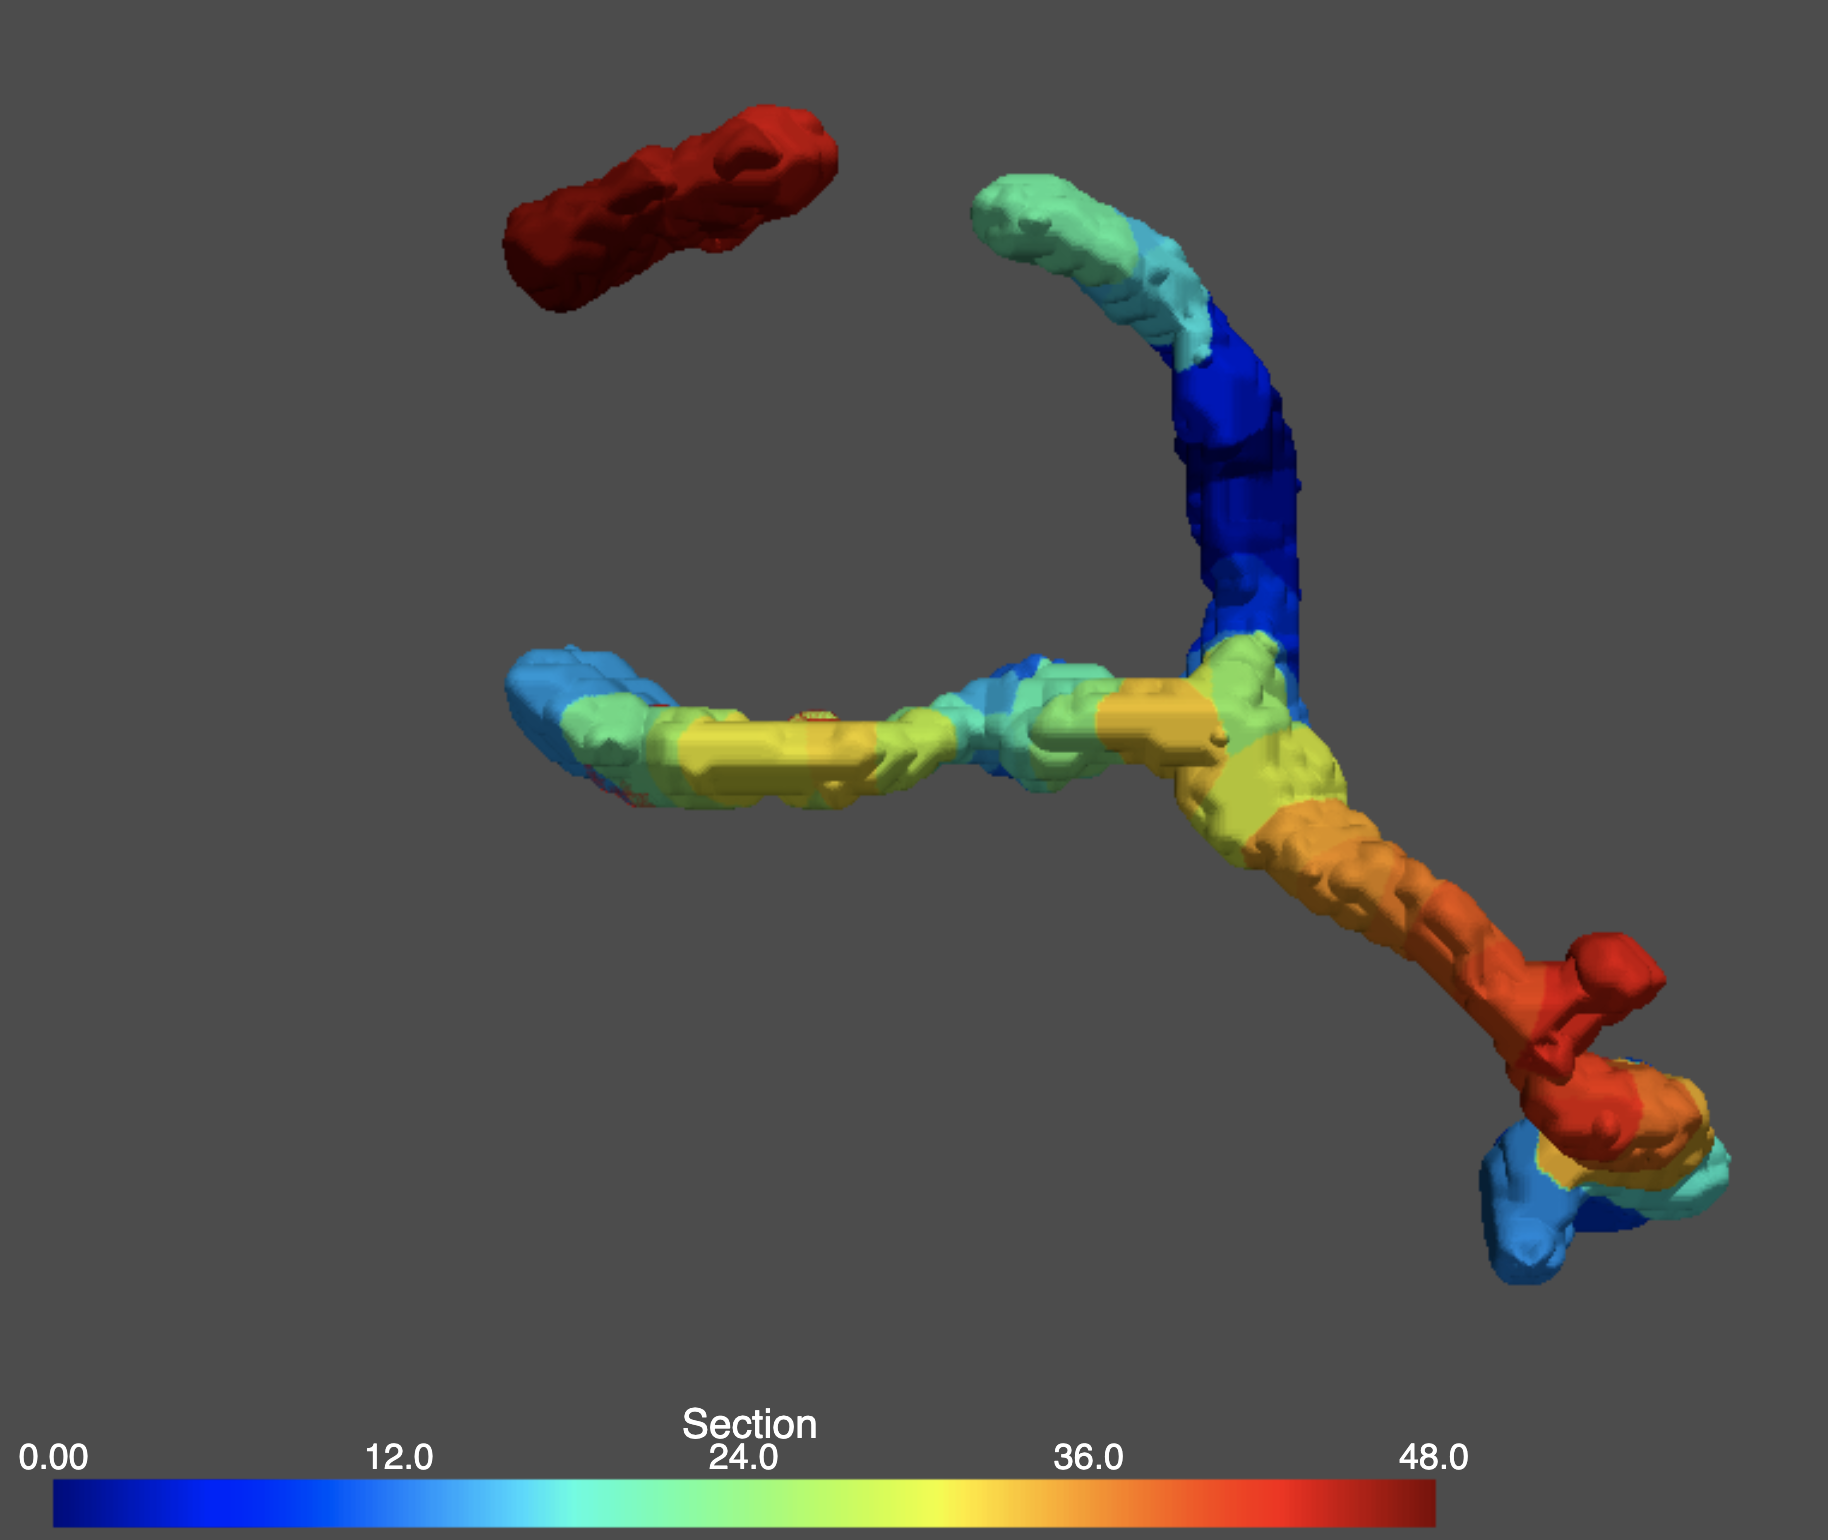
Given a 3D image of a cell’s mitochondria, and a corresponding channel for any other fluorophore, our pipeline can identify the fluorescence concentration of any fluorophore of interest per mitochondria in either snapshot or timeseries images. This process can work with either fluorescently labeled proteins or dyes.
Profile punctate structures within and around the mitochondria
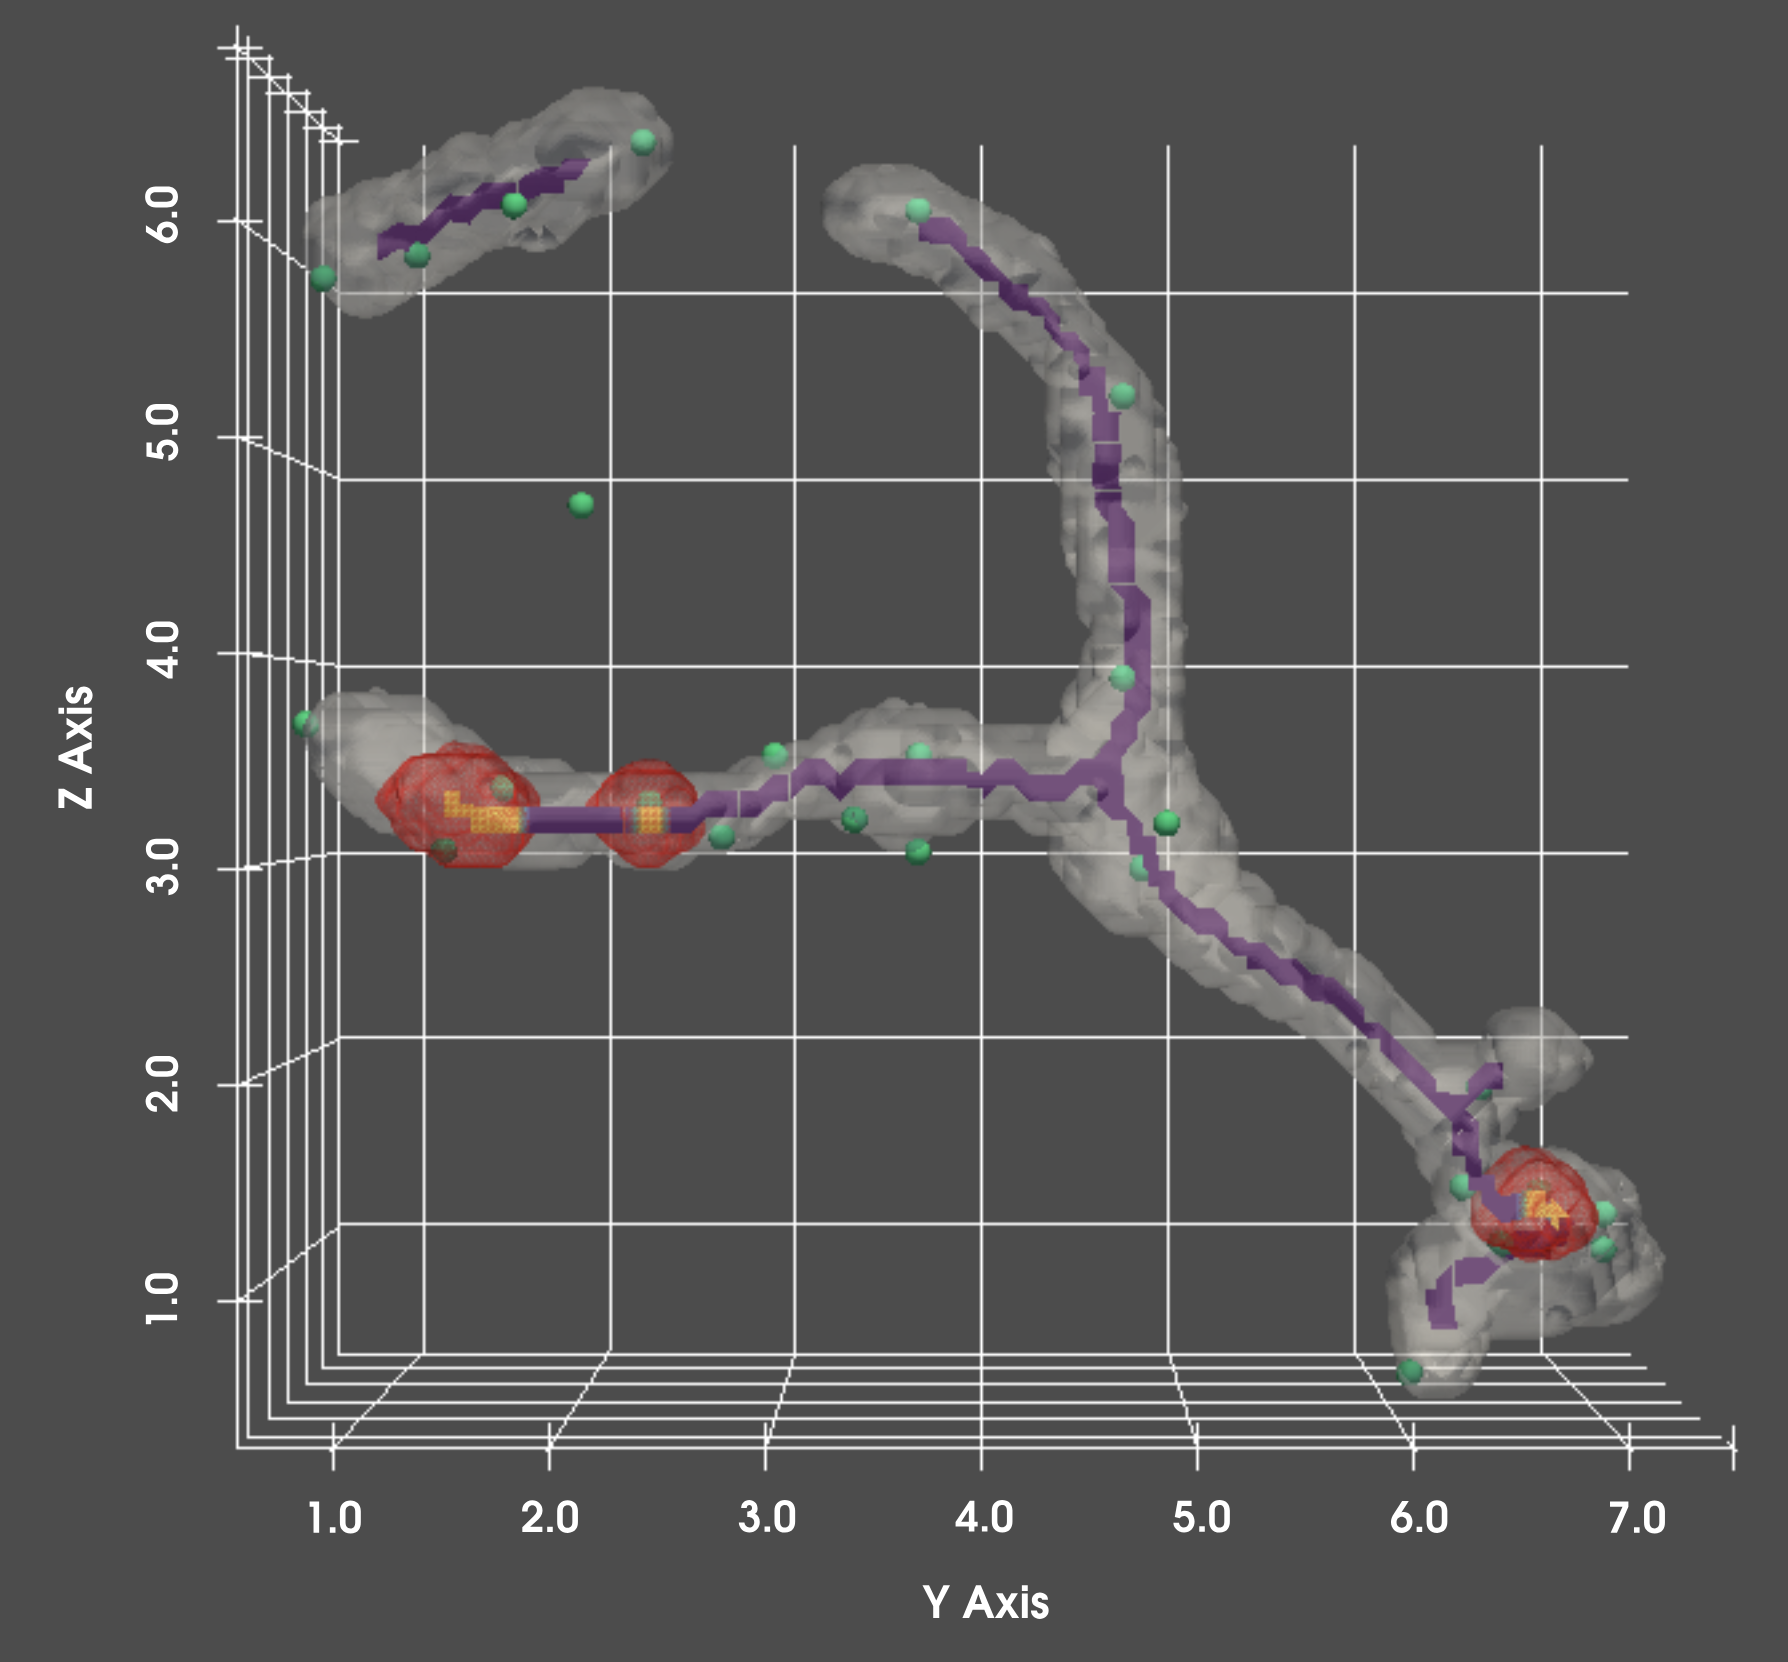
This process can determine the number of discrete structures per mitochondria - for instance determining the number of nucleoids per mitochondria. Structures are not limited to only within the mitochondria–other features we can measure are surface-surface contact sites, or other punctate structures. An example would be for instance quantifying the number of ERMES contact sites, or the number of Dnm1 condensates per unit of surface area on the mitochondria.
Analyze differences in mitochondria content by location, and over time
Changes in location can alter properties of a mitochondria. This pipeline can be run in tandem with our cellular localization pipelines to provide location specific mitochondria statistics, and how those metrics change over time as a consequence of aging, drug exposure, etc.