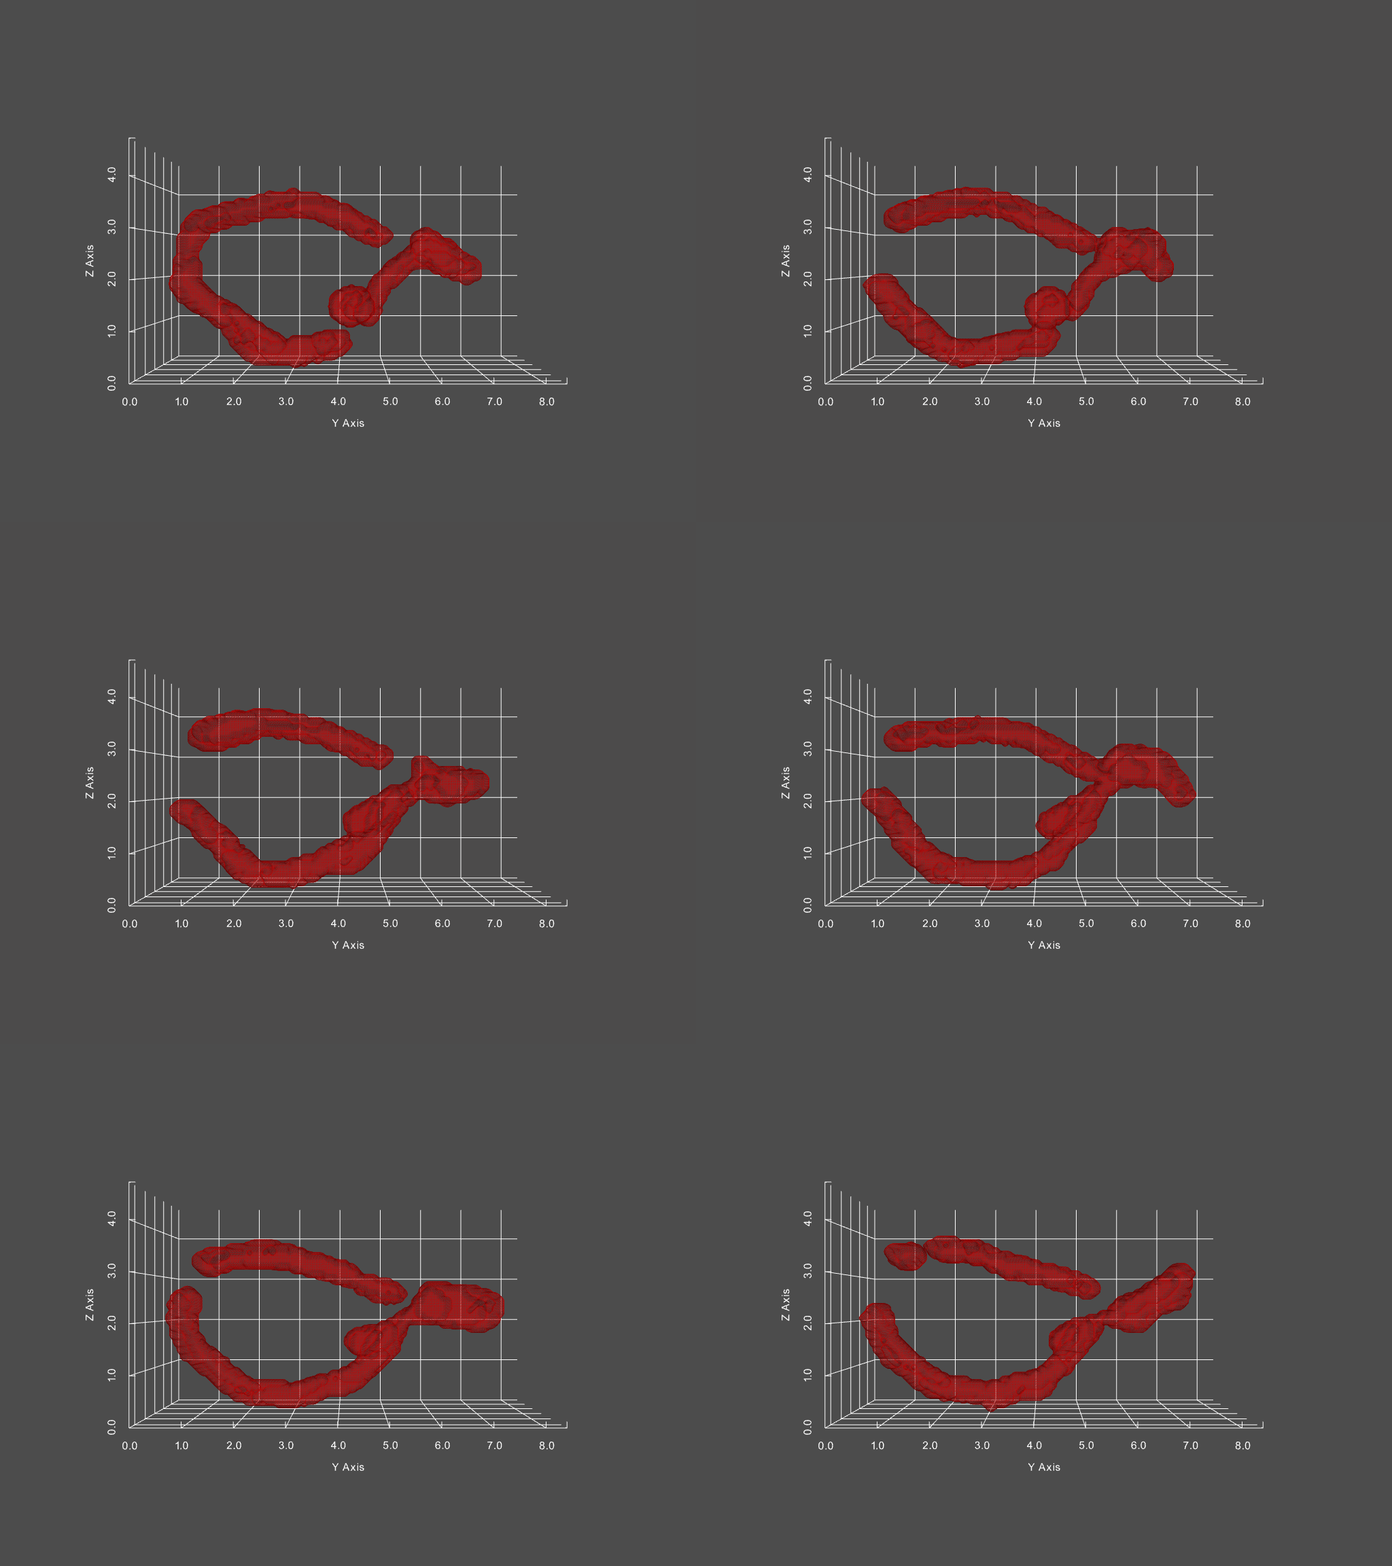
Analyze mitochondrial network dynamics over time (velocity, MSD) and structural remodeling (fission, fusion probabilities, etc.)

Track mitochondria dynamics
Given a movie of a cell’s mitochondria, we can:
- Determine the frequency of fission/fusion events normalized per unit time
- Determine fission/fusion placement on mitochondria structures
- Determine the MSD of a mitochondria
- Identify mitochondria migration from a defined cell region to another cell region (i.e. passage of mitochondria from mother to bud, and vice versa)
Track changing objects within dynamic objects
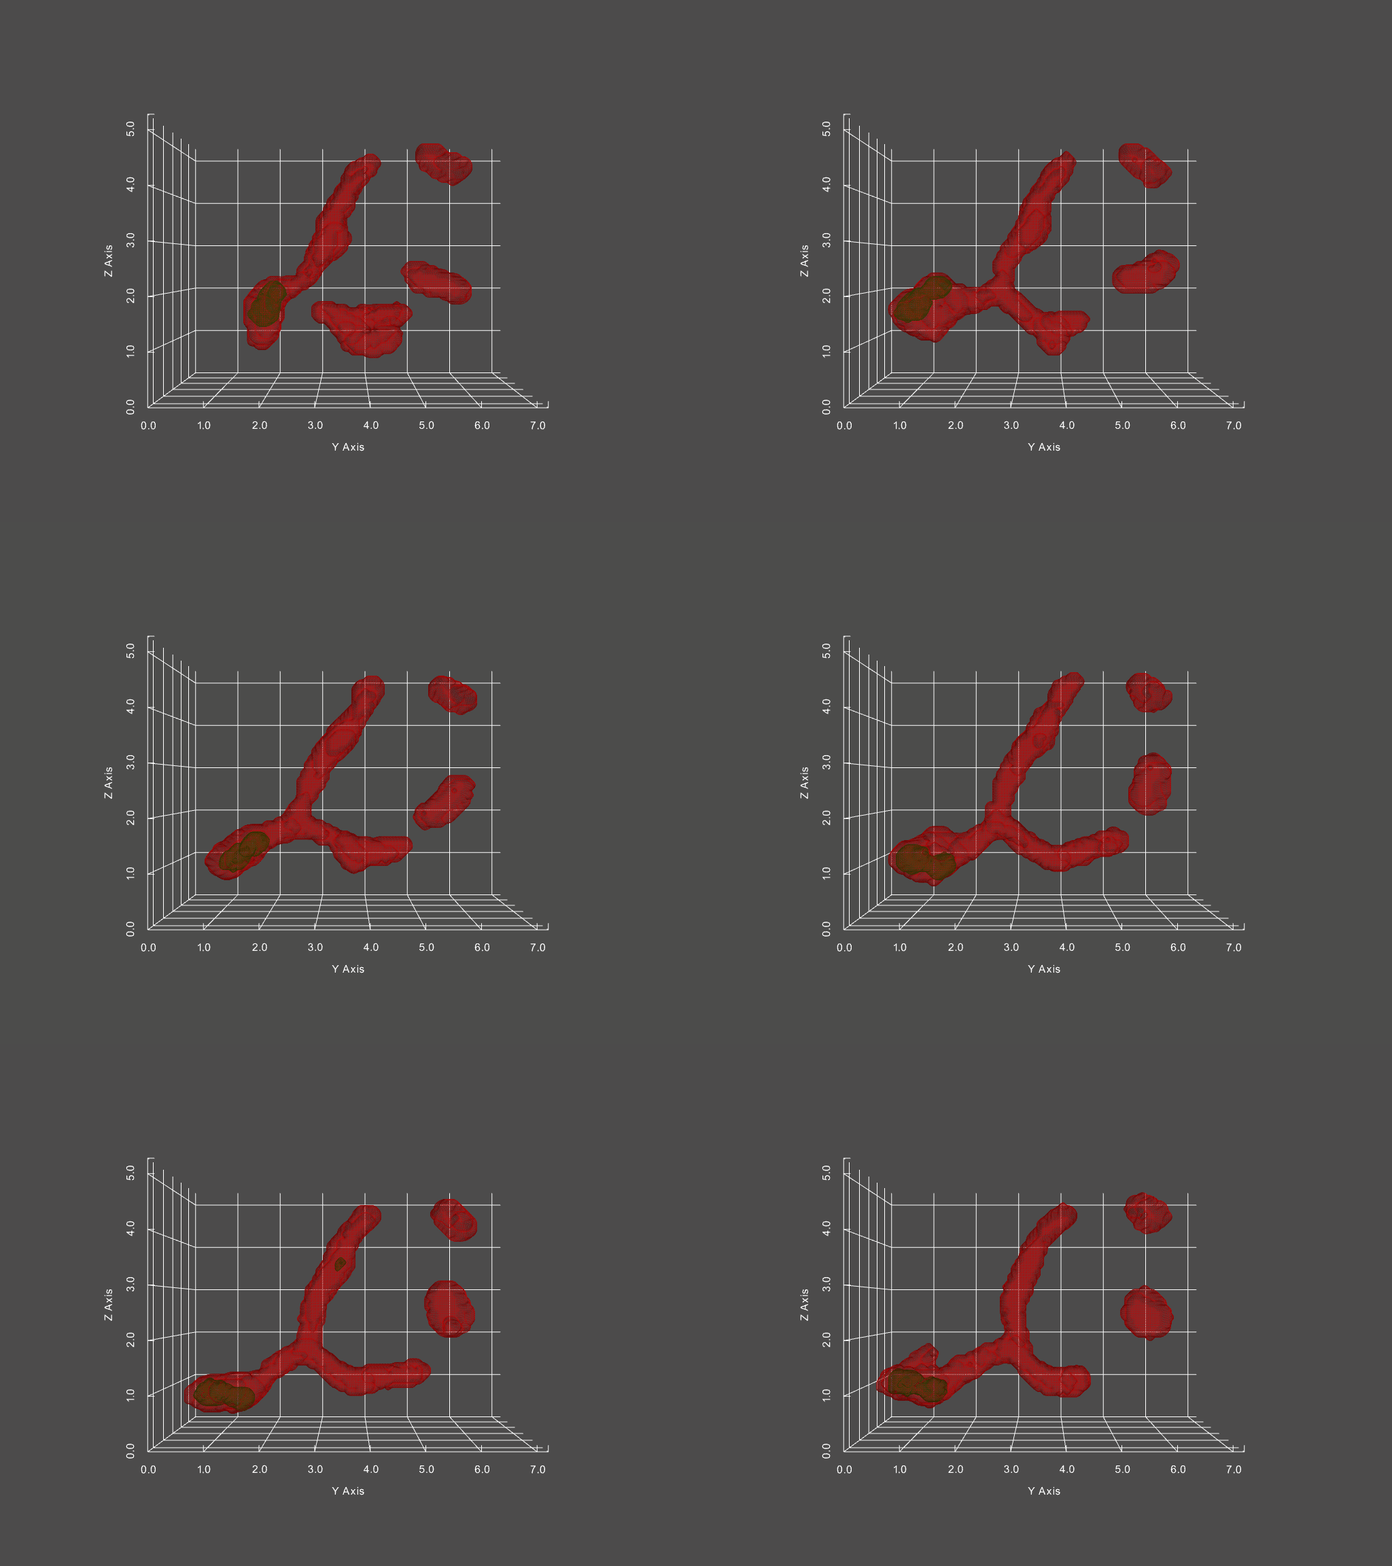
Combined with other segmentation analyses, we can futhermore track the passage of distinct structures within mitochondria from one structure to another. One example is of mitochondrial aggregates (shown below in green, mitochondria is red)

The corresponding network history is below, where each node represents a single mitochondria at a specific moment in time, with time progressing left to right.

The size of each node in the graph represents the mitochondria’s volume, while the color indicates the presence of an aggregate or not (red vs green, respectively). From this representation, we can derive measures, such as the probability of an aggregate bearing mitochondria interacting with a non-aggregate bearing mitochondria, probability of fission, fusion of mitochondria depending on aggregate status, and much more.
Tracking of mitochondria fission/fusion is also robust, able to capture complex rapid events along with the changing state of mitochondrial contents (in this case, aggregate formation and dissolution), as shown below.


Additionally, our pipeline is able to track dynamic objects within the mitochondria as it itself changes. An example would be nucleoid division within the mitochondria network, where an additional time-course network diagram would interface with the mitochondria time-course network diagram.