Fast ML driven 3D volumetric segmentation of fluorescently labeled mitochondria network snapshots or timeseries, with mesh analysis and rendering with Visualization Toolkit (VTK).
Run robust segmentation of mitochondria networks, with reconstruction as 3D VTK meshes and with medial skeleton extraction.
A number of analyses are available for static images; examples are as follows (but are not limited to):
- Number of mitochondria per cell
- Individual volumes/surface areas of each mitochondria per cell
- Localization of mitochondria within the budding yeast cell system
- Fluorescence density of puncta objects on mitochondria structures (i.e. number of nucleoids, nucleoid spacing, punctate protein localization)
- Number of hubs, cycles, tips, and branches in mitochondria network structure (along with other graph algorithms)
- Localization of mitochondria surface objects to other segmentable surface objects within the cell (i.e. distance between mitochondria and ER, vacuoles, nuclei).
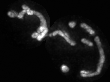
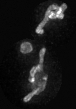
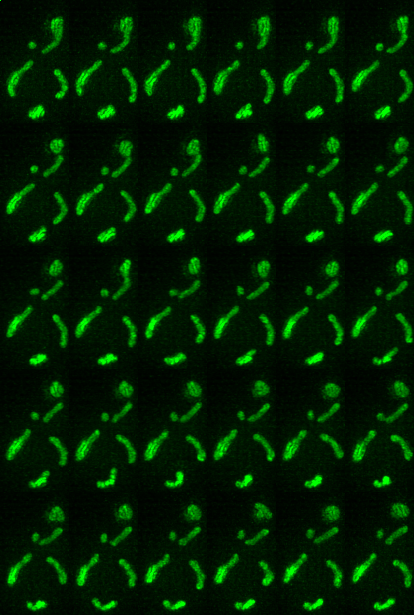
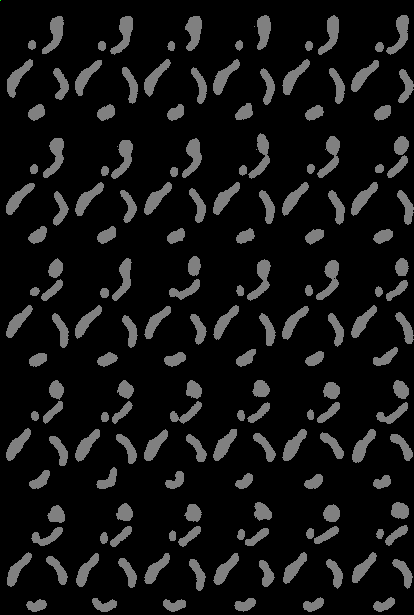
Examples of segmentations and renderings are below. All images are max intensity projections of 3D images.
Snapshot examples:
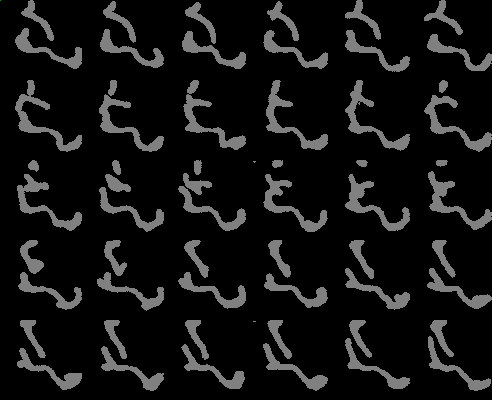
Note segmented snapshots will exhibit different shades of grey for each distinct mitochondria; this is part of the pipeline that can identify unconnected mitochondrial structures.
| Raw Mitochondria signal | Segmented mitochondria |
|---|---|
 |
 |
 |
 |
 |
 |
 |
 |
 |
 |
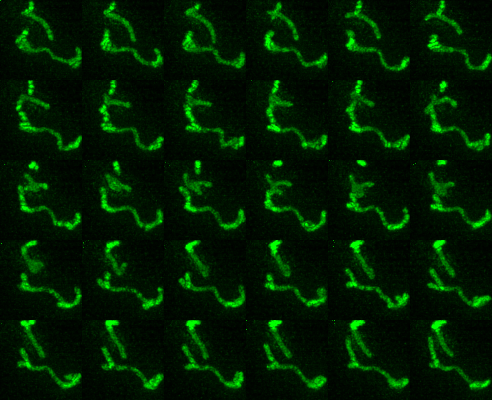
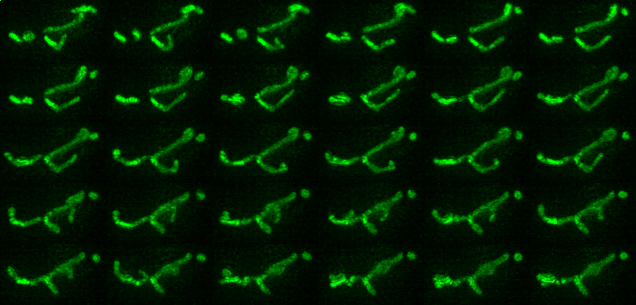
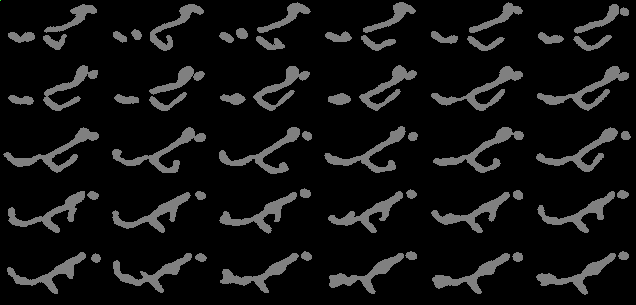
Timeseries examples:
Timeseries progresses left to right, top to bottom.
| Montage of Raw Mitochondria signal | Montage of segmented mitochondria |
|---|---|
 |
 |
 |
 |
 |
 |